Activity 8.10 Class 9 Science Chapter 8 Motion


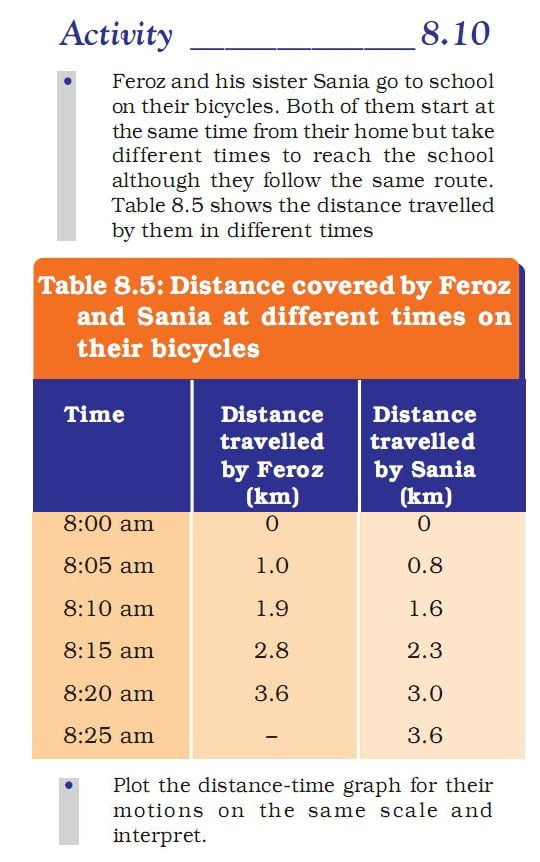
activity 8.10 asks us to correlate the distance-time graph of objects with different speeds.
Answer:
Here we will plot distance on x-axis and time in minutes on the y-axis. Now we need to plot the given distance and time. Once we draw the line, we will get the requested graph. After this, we can interpret it easily.
Here the graph will look like this.
Interpretation:
- The graph is not a straight line for both. It indicates that the speed of each person changes with time. If they had the uniform speed we would have got a straight line.
- Important: Here we see two different graphs for the same distance. It indicates that both people are having different speeds. The area covered in each unit of time indicates the distance. Here it is more for Firoz till 8:20. After 8:20 the total sum of the area represents total distance. So, both, Firoz and Sania will have an equal area on the graph.
Interpretation:
From a graph we can know if the motion is uniform if the line is straight; the area below the slope represents the distance.
Next: Activity 8.9 Class 9 Science Chapter 8 Motion.
See also: Activity 8.11 Class 9 Science Chapter 8 Motion.
Activity 8.10 Class 9 Science Chapter 8 Motion
Ref: NCERT Class 9 Science Chapter 8.
Area below the graph which is not a straight line is not distance in any way .
Distance is already given as 3.6 km .
Area under the graph plotted for firoz is his velocity of his byke .
Area under the graph plotted for Sania is the velocity of her byke
Since the graph Is not a straight line calculation of area is not easy .
Here we have to add the sum of area under each portion .
If it was a curve then we need to to apply integration for calculation af area which is not in our scope .
I may be wrong just expressed my view .
But area of position time graph gives nothing so why is it written that area below the slope gives distance
Can someone find out the velocity of both brother and sister
Exactly correct ✅