Activity 8.9 Class 9 Science Chapter 8 Motion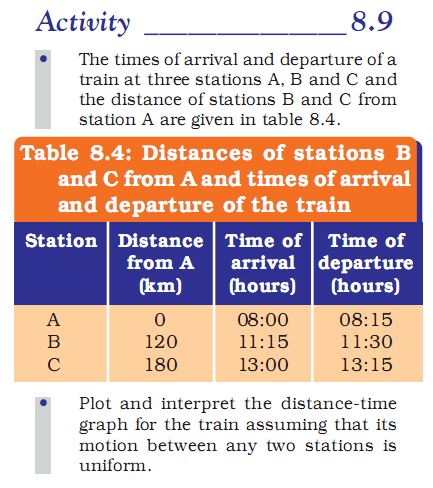
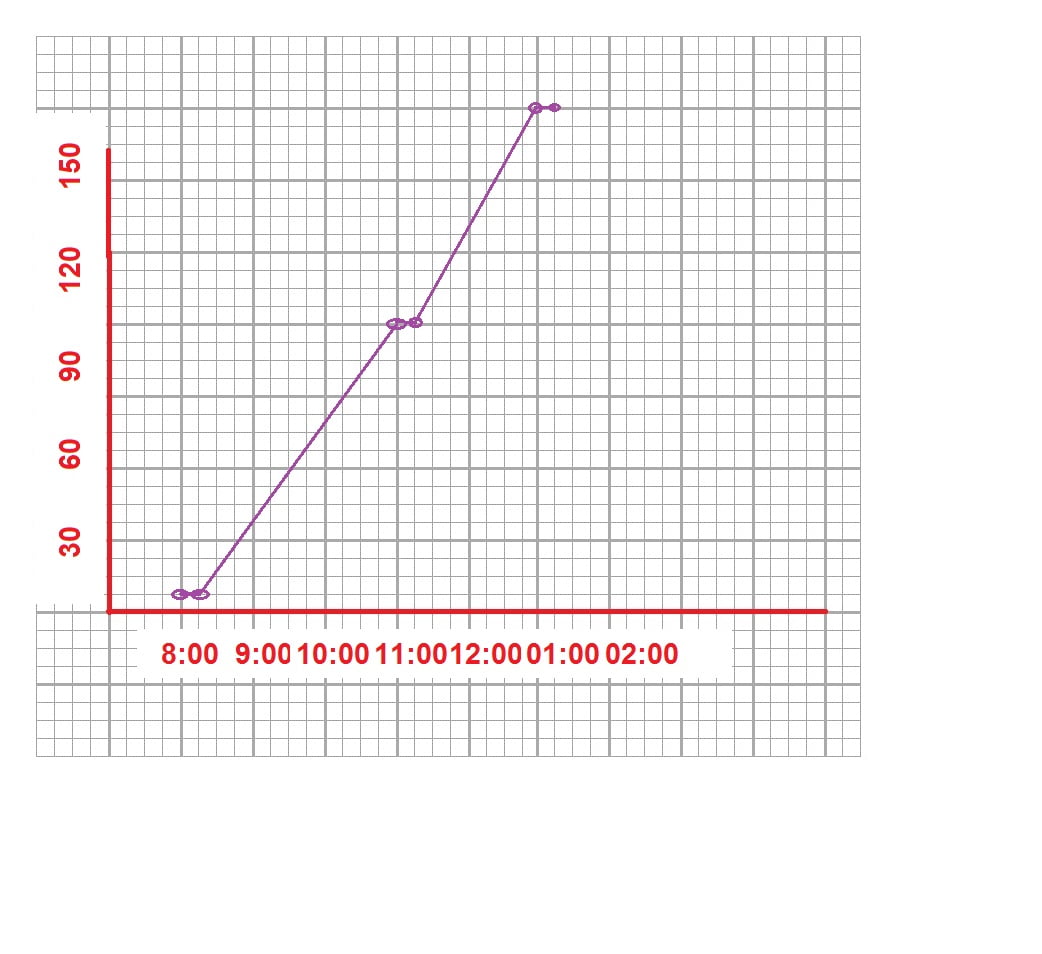
Activity 8.9 asks us to plot a distance-time graph.
We should take two axis on the graph paper. One axis represent distance while the other represents time.
At 8:00 distance = 0km
11:15 distance = 120km
at 13:15 = 180km
For more precision we can add 15 minute time gap at station B and C.
Next: Activity 8.10 Class 9 Science Chapter 8 Motion.
See also: Activity 8.8 Class 9 Science Chapter 8 Motion.
Activity 8.9 Class 9 Science Chapter 8 Motion
Ref: NCERT Class 9 Science Chapter 8.